85+ Car Ownership Statistics
While things like electric vehicles have grown in registration figures and crossover SUVs have taken over 46% of the auto market, there is still an average of 8% of Americans who do not own a vehicle. The U.S. is second to China in terms of the number of total vehicles registered reaching nearly 300 million in 2024.
Key Takeaways
In 2024, there were 296.6 million registered vehicles.
Oklahoma saw a 27.2% increase in registered vehicles in 2024.
Montana has the highest number of registered vehicles per 100 residents, at 184, or nearly two vehicles per person.
White households are 12% more likely to own a vehicle compared to Black households and Black households are nearly 10% lower than the average across all races.
How Many Cars Are There In The U.S.?
In 2024, there were 296.6 million registered vehicles. Of those, approximately 10.6 million were new vehicles. The United States has the second highest number of registered vehicles, behind China.
Though there are disparities in terms of how many Americans own vehicles, the percentages tend to reflect the environment; places like New York City have the highest rate of households without a vehicle at 30% of households but also have one of the most highly urbanized regions as compared to the Daphne-Fairhope-Foley area of Alabama which is highly rural and in which only 2% of households don’t own a vehicle.
How Many Americans Own Cars?
According to the U.S. Census data, the number of Americans who own cars has slowly increased since 2014 going from 9.1% of the population down to 8.3%.
Since 1990 Americans have owned an average of 1.83 cars per household.
Vehicle Registrations Per Year
In 2004, there were 136,430,651 vehicles registered. This figure had only risen by 0.004% by 2008. With a small dip during the recession, vehicle registration continued to climb. The table below indicates registration data from 2016 through 2021:
| Year | Number of Registered Vehicles |
| 2016 | 112,961,266 |
| 2017 | 111,177,029 |
| 2018 | 111,242,132 |
| 2019 | 108,547,710 |
| 2020 | 105,135,300 |
| 2021 | 102,973,881 |
You can see by this data that the number of automobiles alone has diminished over the last few decades however, the number of motor vehicle licensed drivers has continued to increase and as of 2024 was well over 234 million drivers.
Vehicle Registration By Location
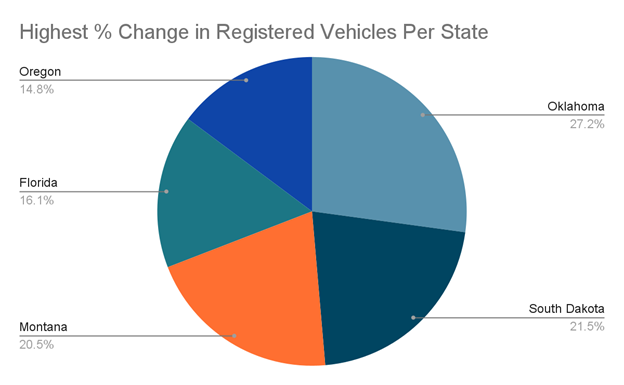
Over the last 10 years, Oregon, South Dakota, Montana, Florida, and Oregon have seen the highest percentage change in the number of registered Vehicles indicating a substantial rise in vehicle ownership. The graphic below indicates these percentages:
Not all states have seen vehicle registration growth during that same time frame, however. Below are the states with the lowest percentage change, many of them having fewer vehicle registrations over the last ten years:
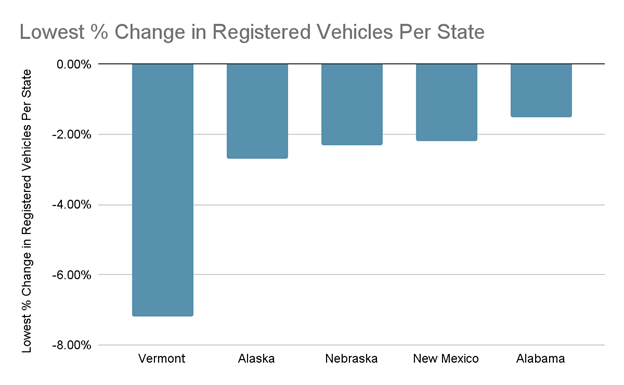
As you can see in the graph above, Vermont, Alaska, Nebraska, New Mexico, and Alabama all saw decline in the number of vehicles registered with the highest decline taking place in Vermont.
- 184: Montana has the highest number of registered vehicles per 100 residents at 184 or nearly two vehicles per person.
- 58: New York State has 58 registered vehicles per 100 people, indicating that nearly half of the population does not have a registered vehicle associated with their name.
Some cars have higher registration figures than others. The table below indicates that number of registered electric vehicles in 2023 across different states based on the Alternative Fuels Data Center:
| State | Electric (EV) | Plug-In Hybrid Electric (PHEV) | Hybrid Electric (HEV) |
| Alabama | 13,000 | 5,800 | 63,300 |
| California | 1,256,600 | 410,700 | 1,703,200 |
| Florida | 254,900 | 57,300 | 414,500 |
| Kansas | 11,300 | 5,600 | 50,400 |
| Massachusetts | 73,800 | 43,800 | 187,300 |
| New Jersey | 134,800 | 40,900 | 174,200 |
| New York | 131,300 | 92,300 | 314,000 |
| South Dakota | 1,700 | 1,300 | 11,900 |
| Texas | 230,100 | 55,300 | 445,100 |
Car Ownership By Location
The U.S. Census Bureau American Community Survey data revealed that only 8.45% of Americans don’t have a car, or at least access to one. This has remained roughly the same since 2015.
However, this changes based on state:
- 26%: Florida, California, and Texas combined represent 26% of all registered vehicles.
- 12 million: Between 2015 and 2020 there was an increase of over 12 million registered vehicles.
The table below indicates the states with the highest percentage of homes with no car access:
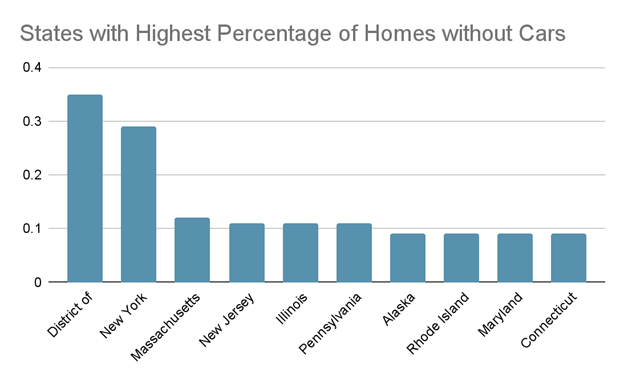
Source: Census
Out of the 50 largest cities in the United States, there are several that have nearly 100% household access to one vehicle meaning almost all homes in that city own a car.
- 96.1%: 96.1% of all households in Raleigh, North Carolina have access to a vehicle.
- 1.96: In Raleigh, there is one point nine six vehicles per household.
- 95.8%: 95.8% of all households in Nashville have access to a vehicle.
- 1.98: Nashville has 1.98 vehicles per household, almost two for every house in the city.
- 95.7%: Riverside, California boasts 95.7% of households having access to a vehicle.
- 2.14: There are 2.14 vehicles per household in Riverside, California, indicating more than two cars per household, the highest number of all 50 largest cities across the United States.
Car Ownership By Demographics
How does car ownership change based on demographics like race, income, or gender?
- 22%: In 2006, 22% of low-income adults had no access to a vehicle.
- 2%: By 2016 the number of low-income adults with no access to a vehicle declined by 2%.
- 2x: Studies have found that households with vehicle ownership earned nearly twice the income as those without.
While owning a car has been statistically correlated to higher income earnings, the cost of the average auto loan has increased over the last 6 years making it even more challenging for those without a vehicle to own one.
Car Ownership By Race
Demographics of car ownership change quite dramatically when comparing across different races. Consider the chart below in relation to the average percentage of vehicle ownership across all races at 91%:
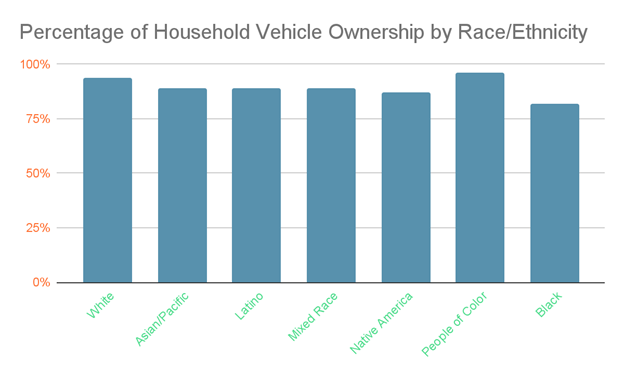
As indicated in the chart above, white households are 12% more likely to own a vehicle compared to Black households and Black households are nearly 10% lower than the average across all races.
In addition to lower levels of vehicle ownership, studies have determined that 76% of Black households are financially burdened by their transportation costs, meaning they spend more than 15% of their monthly income on the cost of vehicle ownership, as compared to only 60% for white households.
Per year, Black households spend an average of $1,115 more per vehicle, per year compared to other races.
Car Ownership By Age
People who are 45 and older are most likely to own cars compared to any other age group. This number continues to go up starting at age 40 every 5 years until around age 75, when the figures drop to the same as 40 year olds. Consider the table below:
| Age Group | Percentage of Car Owners in Age Group |
| 35-39 | 5% |
| 40-44 | 7% |
| 45-49 | 8% |
| 50-54 | 11% |
| 55-59 | 12% |
| 60-64 | 13% |
| 65-69 | 12% |
| 70-74 | 10% |
| 75-79 | 7% |
Car Ownership By Car Type
Crossover SUVs, a blend of passenger car comfort with SUV height and chassis, are the most popular type of car on the market. The table below indicates market share of the most common car types across America:
| Car Type | Percentage of Auto Market |
| Crossover | 46% |
| Pickup trucks | 20% |
| SUVs | 10% |
| Midsized cars | 8% |
| Small cars | 6% |
| Luxury cars | 5% |
| Vans | 4% |
| Large vehicles | 1% |
One of the growing categories among vehicle registration is electric vehicle ownership.
Electric Vehicle Ownership
Electric vehicle ownership has increased over the last few years in particular in states that have implemented new emissions standards like California.
- 5 million: There were 3.5 million electric vehicles registered across the United States in 2023.
- 7.9%: In 2024 electric vehicles represented 7.9% of all newly registered vehicles.
- 35%: California has the highest number of electric vehicles representing 35% of all electric vehicle ownership nationwide.
The table below indicates the top five states for vehicle ownership:
| State | Number of EVs Registered as of 2023 in the state |
| California | 1,256,646 |
| Florida | 254,878 |
| Texas | 230,125 |
| Washington | 152,101 |
| New Jersey | 134,753 |
How Much Does Car Ownership Cost?
Owning a car has become significantly more expensive over the last 75 years. In 1960, car ownership cost around $17 billion but today has increased over 3,000 percent to nearly $600 billion.
According to the BTS, personal auto expenditures have changed over the last several years based on factors like insurance premiums, maintenance, and cars themselves.
Consider the table below for costs of car ownership from 2018 through 2021:
| 2018 | 2019 | 2020 | 2021 | |
| Personal Auto Expenditures, total (millions of dollars) | 1,225,180 | 1,226,573 | 1,129,935 | 1,424,121 |
| New cars | 286,392 | 285,736 | 292,820 | 351,242 |
| Used cars | 159,100 | 153,776 | 161,434 | 243,040 |
| Parts and accessories | 75,383 | 77,490 | 79,674 | 94,438 |
| Gas and oil | 328,430 | 316,225 | 230,307 | 347,630 |
| Maintenance and repairs | 187,580 | 196,316 | 183,380 | 195,058 |
| Insurance premiums | 77,327 | 82,699 | 80,680 | 82,240 |
As indicated by the chart above the average costs have increased over the last several years with the biggest leap being the price of parts and accessories and the cost of cars themselves.
Car Ownership And Insurance
How does car insurance impact car ownership costs? Insurance is one of the more expensive categories for car ownership especially as American families might attempt to save money by investing in used cars only to find their premiums are raised as a result of the risk used cars pose.
Cheapest Cars To Insure
Below is the average annual insurance premium for different cars:
| Car Type | Average Annual Insurance Premiums |
| Minivans | $1,617 |
| SUVs | $1,198 |
| Pickup Trucks | $1,698 |
| EVs | $2,224 |
| Sedans | $2,258 |
Minivans only account for 4% of the current vehicle ownership in the United States and yet are among the cheapest vehicles to ensure followed by SUVs and pick up trucks which account for 10% and 20% of the market respectively.
What’s the Future Of Car Ownership?
While there has been a rise in car ownership, historical data is not a guarantee of future car ownership. During the pandemic there was a shortage of key vehicle parts which led prices for new and used vehicles to skyrocket alongside the prices of maintenance, repairs, and insurance.
As more people are able to access public transportation, working from home, and looking out for self-driving cars, the number of vehicles registered per household may dip in future.
Moreover, tables indicating personal expenses for car ownership especially as compared to ride sharing services and public transportation may have an impact on the future of car ownership.
That said, as electric vehicle ownership continues to rise particularly in states like California where electric vehicle incentives have made it easier for families to purchase EVs, this may very well become a more popular vehicle option for many households.